Stocks Scanners
Docs
Terms and Policy.
Stocks Scanners
Docs
Terms and Policy.
| Filter Description | This filter allows traders to scan for stocks based on their market price. It helps match stocks with the user's budget or trading strategy. |
|---|---|
| Default Range | From $0.01 to $3000 |
| Why It Matters |
|
| Example | To focus on stocks between $5 and $50, define this price range |
| Validation | Price values must be zero or higher |
| UI Tip | 🎯 "Scan only stocks within your price range." |
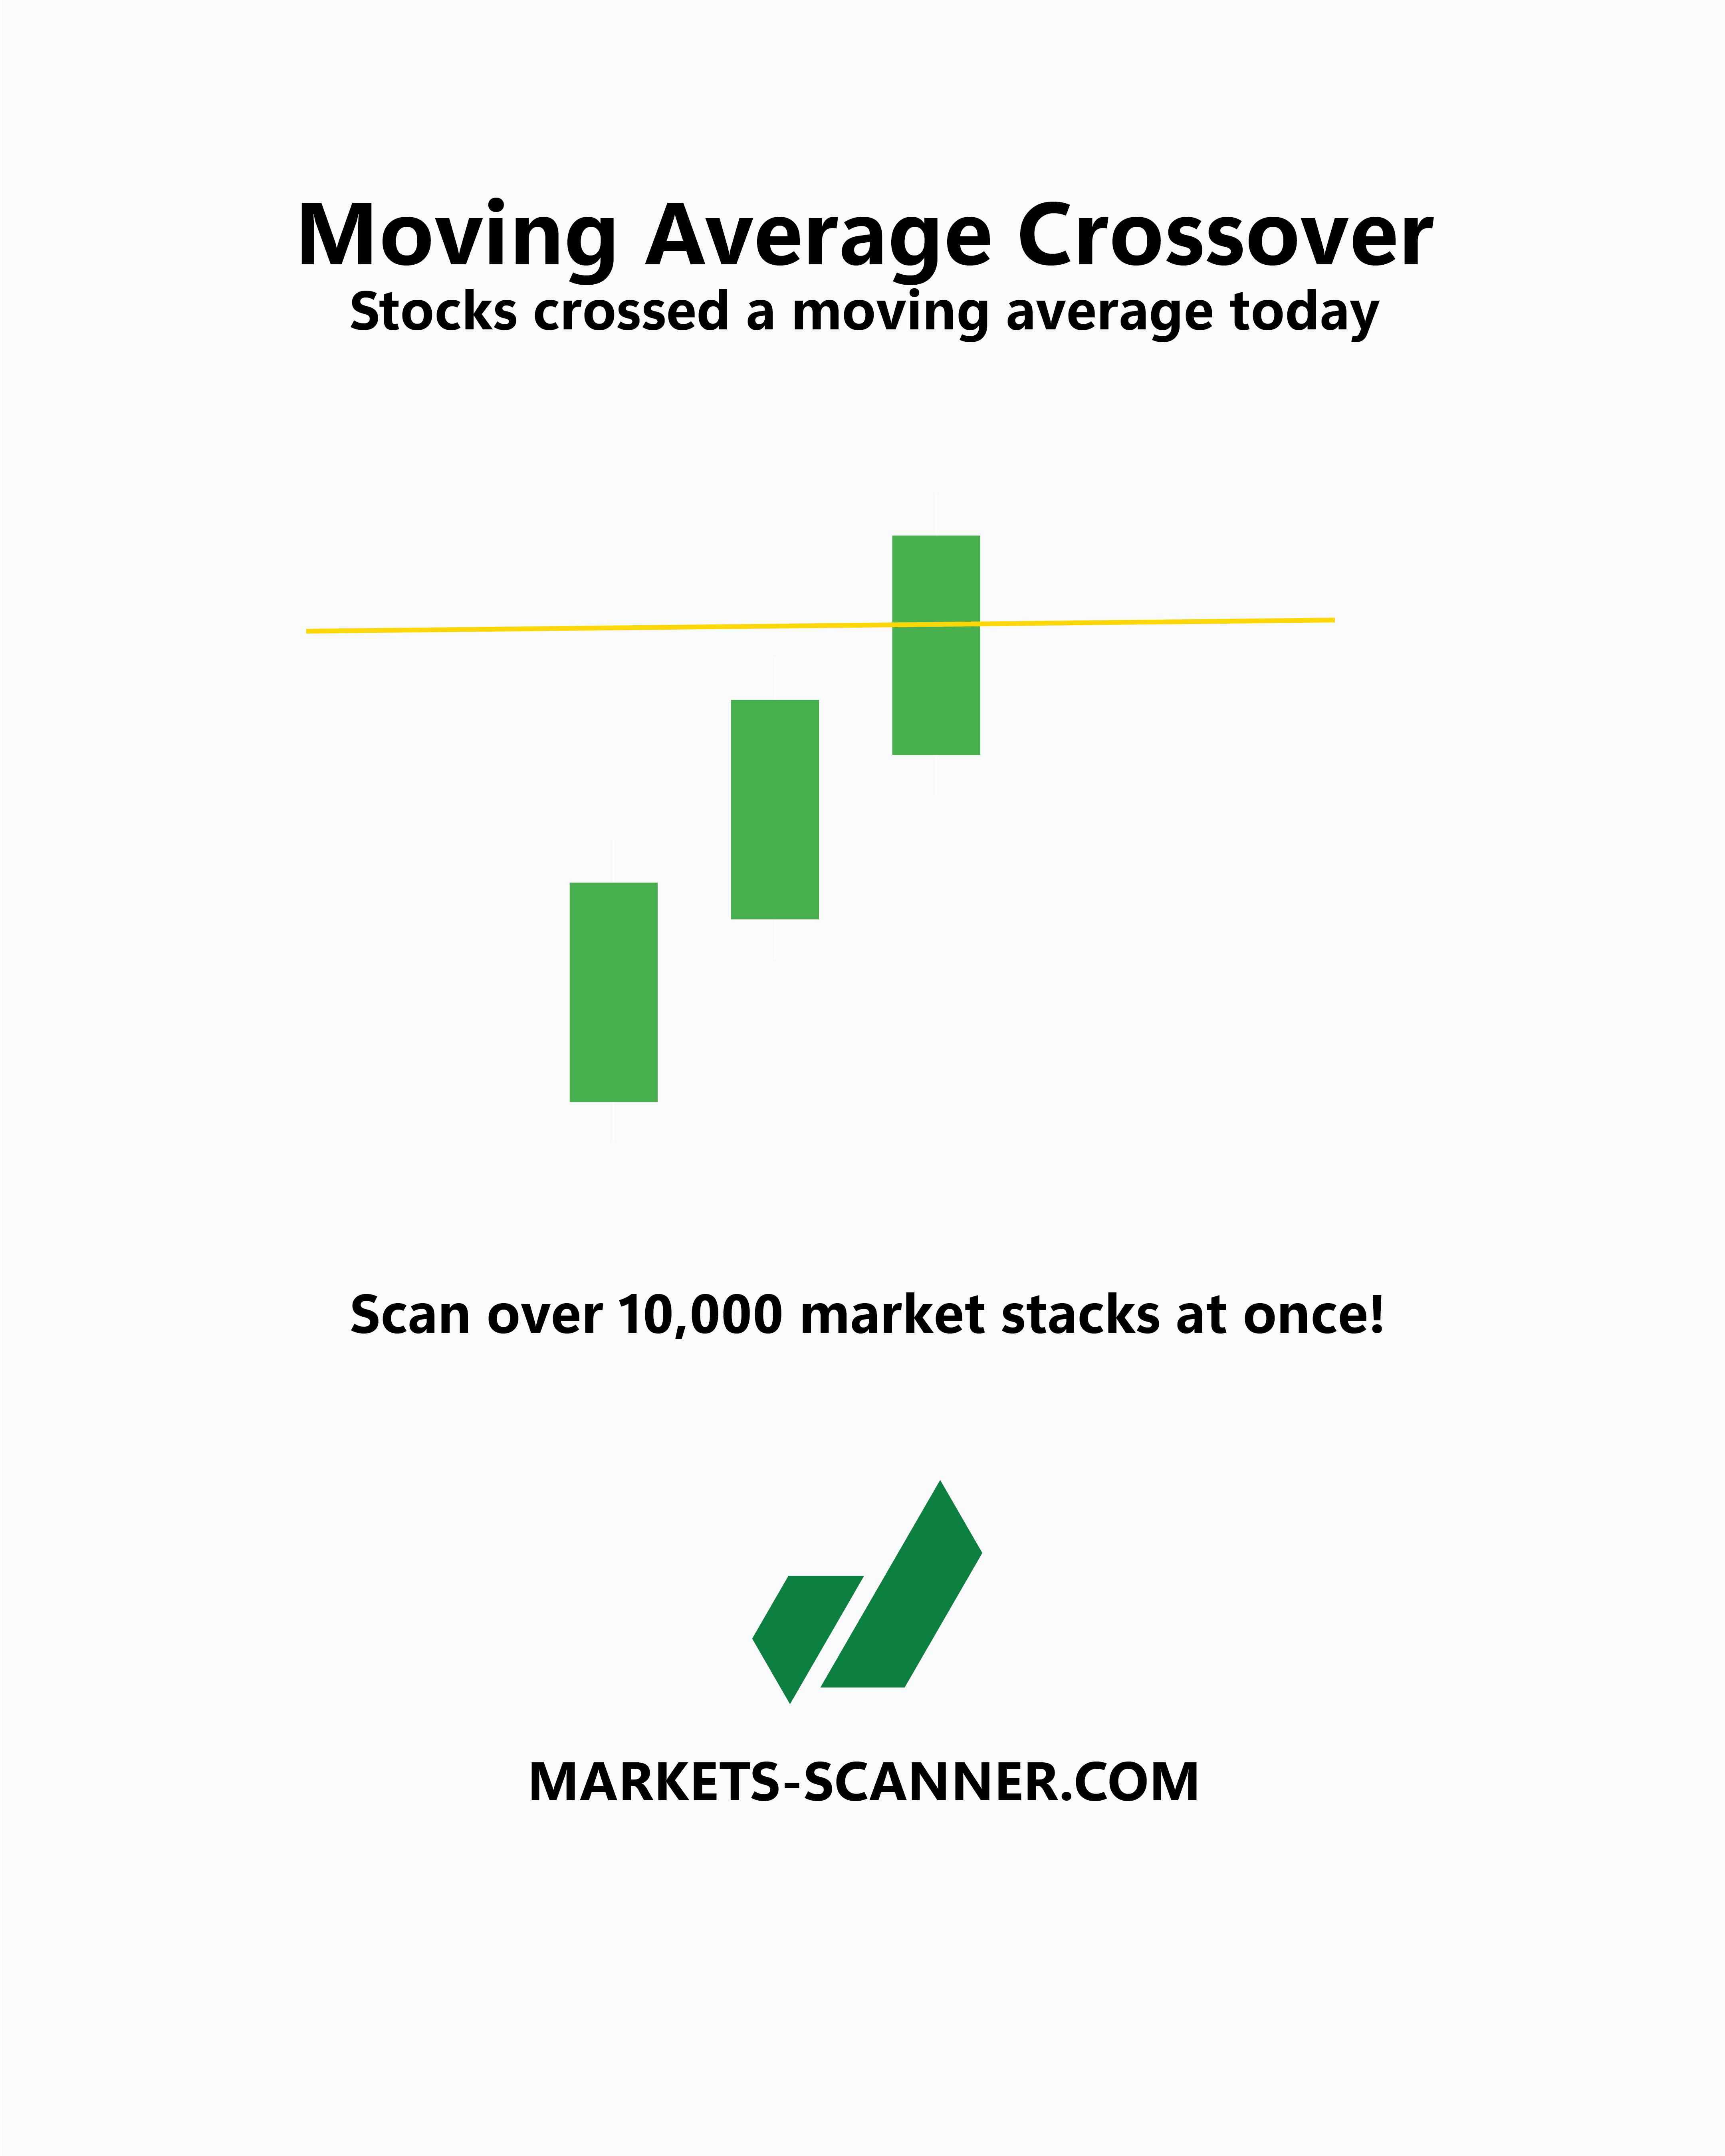
| Filter Description | This filter allows users to scan for stocks trading above or below a selected moving average (MA), which can range from 5 to 150 days. It also includes a powerful option to look back in time and check when the stock crossed the MA. |
|---|---|
| Options |
|
| Unique Feature | Users can filter stocks that crossed the selected MA within a defined period — e.g., between Day 2 and Day 5 — providing precise entry signal detection. |
| Why It Matters |
|
| Example | Scan for stocks that crossed above MA 20 between the last 2 to 5 days |
| UI Tip | 🧭 "Find precise MA crossovers by choosing your preferred lookback range." |
| Filter Description | This filter allows users to scan for stocks based on their current price location relative to classic support and resistance levels: R3, R2, R1, Pivot Point (PP), S1, S2, and S3. |
|---|---|
| Options |
|
| Why It Matters |
|
| Example | Scan for stocks currently priced between R2 and R3 to find strong bullish setups |
| UI Tip | 🧱 "Find stocks near major support or resistance levels." |
| Filter Description | This filter allows users to scan for stocks based on their current RSI (Relative Strength Index) value, which measures the strength and momentum of price movements. Users can define a custom RSI range to focus on overbought, oversold, or neutral conditions. |
|---|---|
| Options |
|
| Why It Matters |
|
| Example | Scan for stocks with RSI between 30 and 40 to find possible oversold bounce opportunities |
| UI Tip | 📉 "Target stocks by RSI range to find momentum shifts and reversal zones." |
| Filter Description | This advanced filter helps detect and categorize stock gaps – the difference between a stock’s previous close and its next opening price. Gaps can reveal strong shifts in market sentiment and are often used to identify breakout trades. |
|---|---|
| Options |
|
| Why It Matters |
|
| Example | Find stocks that gapped up by 3% or more on high volume and closed green → potential bullish momentum setup |
| UI Tip | 📊 "Combine gap direction, candle type, and volume to detect strong market signals." |
| Filter Description | This filter allows users to scan for stocks based on the candlestick pattern formed on the most recent trading day. These patterns are essential for recognizing potential reversals, continuations, or market indecision. |
|---|---|
| Options |
|
| Why It Matters |
|
| Example | Scan for stocks that closed with a Bullish Engulfing candle → possible trend reversal upward |
| UI Tip | 🕯️ "Spot key candlestick patterns to identify entry or exit signals with precision." |
| Filter Description | This filter identifies stocks that recently re-entered the Bollinger Bands after closing outside their boundaries the previous day. These crossovers may signal a volatility shift or a possible reversal. |
|---|---|
| Options |
|
| Why It Matters |
|
| Example | Scan for stocks that re-entered below the lower band — this might indicate a short-term bottom forming |
| UI Tip | 📉 "Catch key Bollinger crossovers to anticipate price reversals or contraction." |
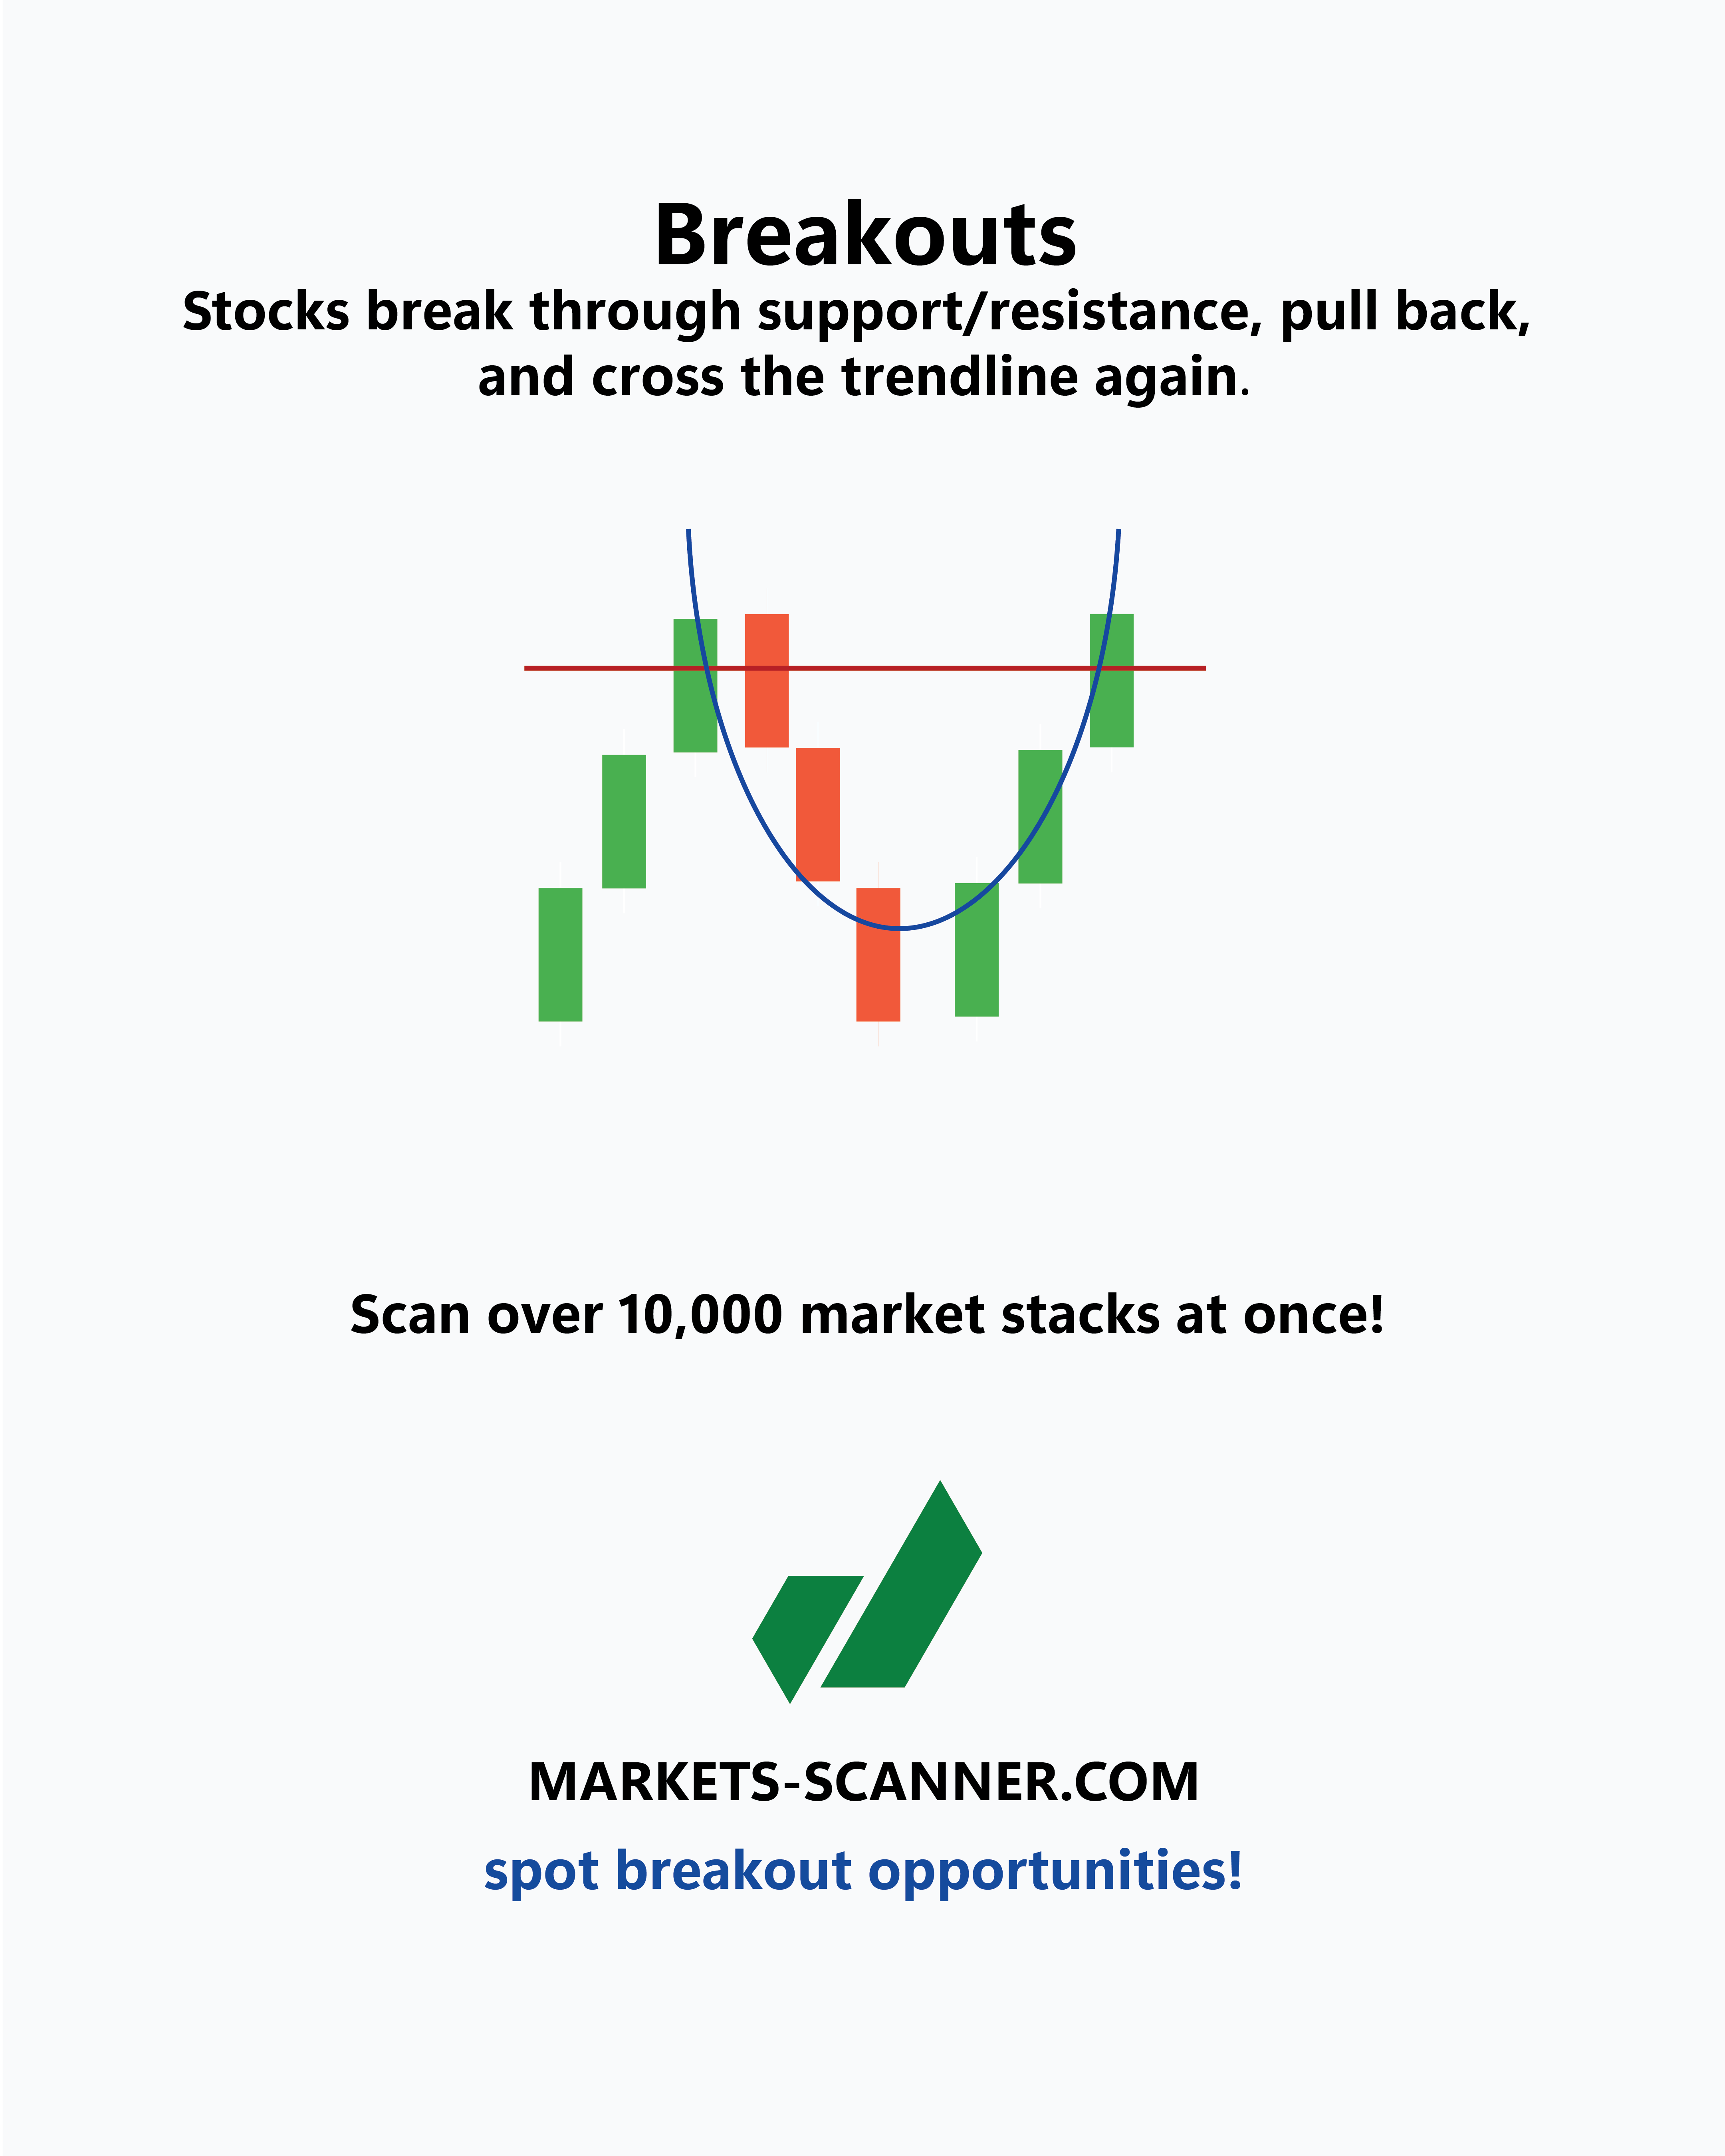
| Filter Description | This filter highlights stocks that have recently broken through key support or resistance levels, such as R1, R2, S1, S2, or the Pivot Point (PP). Breakouts often indicate strong momentum or a shift in market sentiment. |
|---|---|
| Options |
|
| Why It Matters |
|
| Example | Find stocks that recently broke above R2 and are showing strong momentum upward |
| UI Tip | 🚨 "Spot breakouts near key price levels – powerful signals for active traders." |
| Filter Description | This filter allows users to identify stocks experiencing unusually high trading volume compared to their recent average. Volume spikes often confirm the strength of price movements or reveal unusual market activity. |
|---|---|
| Options |
|
| Why It Matters |
|
| Example | Scan for stocks with volume over 100% of the 10-day average — likely a breakout or reaction to earnings/news |
| UI Tip | 📊 "Find stocks with unusual activity by filtering volume spikes." |
| Filter Description | This filter helps users identify where a stock currently trades relative to its recent 52-week high or low. It's useful for spotting breakout candidates, oversold opportunities, or stocks trading near key price extremes. |
|---|---|
| Options |
|
| Why It Matters |
|
| Example | Scan for stocks trading within the top 10% of their 52-week range to catch momentum breakouts |
| UI Tip | 📈 "Target breakouts or reversals by scanning price extremes." |
| Filter Description | This filter allows users to screen for stocks based on their daily percentage price change. It’s useful for spotting momentum movers, intraday breakouts, and extreme gainers or losers. |
|---|---|
| Options |
|
| Why It Matters |
|
| Example | Scan for stocks that dropped more than 10% today → potential oversold bounces or short setups |
| UI Tip | 📉 "Find biggest winners and losers based on daily percent change." |
| Filter Description | This filter allows users to find stocks based on their scheduled earnings report date. It’s ideal for traders and investors who want to focus on pre-earnings or post-earnings opportunities. |
|---|---|
| Options |
|
| Why It Matters |
|
| Example | Filter for all stocks reporting earnings this week to spot high-potential setups |
| UI Tip | 🗓️ "Stay ahead of the market by knowing when earnings reports are scheduled." |
| Filter Description | This flexible filter allows users to screen stocks based on key financial metrics from a company’s income statement, balance sheet, and cash flow. You can combine multiple conditions to fine-tune your results. |
|---|---|
| Available Fields |
|
| How It Works |
|
| Example | Filter for companies with EPS > 2 and Market Cap > $1B to find fundamentally strong stocks |
| UI Tip | 💼 "Build your own custom financial screening logic – combine metrics to match your strategy." |
These filters are used to assess a stock's potential behavior before an upcoming earnings report. They combine technical, sentiment, and statistical indicators to help detect high-probability setups.
| Parameter | Condition | Possible Score |
|---|---|---|
| eps_estimate | Above the company's historical average | +2 |
| revenue_estimate | Strong growth compared to the same quarter last year | +2 |
| YoY growth | Greater than 5% | +2 |
| price_change_7d | Price change over ±5% in the last 7 days | +1 |
| beta | Greater than 1.5 → High volatility expected | +1 |
| peg_ratio | Less than 1 → Good growth at a fair price | +1 |
| future_earnings | Earnings report scheduled within the next 48 hours | +1 |
Why It Matters: High-scoring stocks are often more volatile during earnings, offering trading opportunities. Low scores indicate calmer market expectations.
| Parameter | Condition | Possible Score |
|---|---|---|
| short_interest | Greater than 10% | +2 |
| days_to_cover | More than 3 days | +1 |
Why It Matters: Stocks with high short interest and long days to cover may trigger aggressive short squeezes, especially when earnings beat expectations.
| Parameter | Condition | Possible Score |
|---|---|---|
| implied_volatility | Above 130% of average IV | +2 |
| options_volume_ratio | Volume/Open Interest > 2 | +1 |
Why It Matters: Elevated implied volatility or options activity often signals traders are preparing for a significant move around earnings.
| Parameter | Condition | Possible Score |
|---|---|---|
| analyst_upgrades_last_7d | 2 or more upgrades in the last 7 days | +2 |
| analyst_upgrades_last_7d | 1 upgrade in the last 7 days | +1 |
Why It Matters: Frequent analyst upgrades shortly before earnings often reflect strong internal performance or expected surprises.
Scoring System: Each section produces a separate score and signal. You can filter stocks by individual signal (e.g., only "Hot Earnings") or combine them for comprehensive analysis.
UI Tip: 🎯 “Use the pre-earnings filters to find stocks with the strongest potential for volatility and movement before the earnings release.”
These filters evaluate how a stock behaved following the release of its earnings report. They help assess market reaction, detect momentum signals, and identify divergence between financial results and price behavior.
| Parameter | Condition | Possible Score |
|---|---|---|
| actual_eps vs eps_estimate | EPS Beat = +1, Miss = -1 | ±1 |
| actual_revenue vs revenue_estimate | Revenue Beat = +1, Miss = -1 | ±1 |
| percent_change_post_earnings | Used in combination to detect alignment with results | ↔️ |
Why It Matters: Aligning price change with earnings results helps determine whether the market approved or rejected the report.
| Parameter | Condition | Impact |
|---|---|---|
| price_gap | Gap > ±3% compared to previous close | 📊 May indicate emotional reaction |
Why It Matters: Large gaps following earnings often reflect surprise or overreaction by investors. They are commonly used in gap trading strategies.
| Parameter | Condition | Impact |
|---|---|---|
| volume_spike | Volume > 2x average volume | 🔍 Confirms strength of price move |
Why It Matters: A surge in volume validates the price movement post-earnings, indicating commitment from large investors or institutions.
| Scenario | Interpretation |
|---|---|
| Gap Up + High Volume + Price ↑ | 🚀 Strong breakout – Potential Buy |
| Gap Down + High Volume + Price ↓ | 📉 Bearish gap down – Potential Short |
| Mismatch between performance & price | ❗ Divergence detected – Wait for confirmation |
| Neutral or no data | ⚪ Insufficient info or low signal |
Why It Matters: Helps interpret the earnings reaction and decide on the next trade – whether to buy, short, or wait for confirmation.
UI Tip: 📈 “Analyze how the market reacted to earnings – combine price gaps, volume, and results for high-confidence signals.”
✅ More filter sections will be added below as we progress with building the system.
Copyright © 2024 markets-scanner.com. All Rights Reserved. Privacy policy